GraphViewer Examples
Following are a few examples of graphs generated in the GraphViewer based on the CLARIN metadata schemas. The links point either to a static exported [SVG] graph, to a rasterized [PNG] version of it, or live to the [SMC] browser. (With live links, sometimes, the graph does not get rendered right away. In such case just change any of the options to refresh the graph pane.) Links pointing to the definition of given term either in Component Registry or ISOcat are marked with [DEF].
Description
By far the most often used data category is description [DEF] (used in 44 profiles on 550 elements). Following image depicts the surroundings of this description data category:
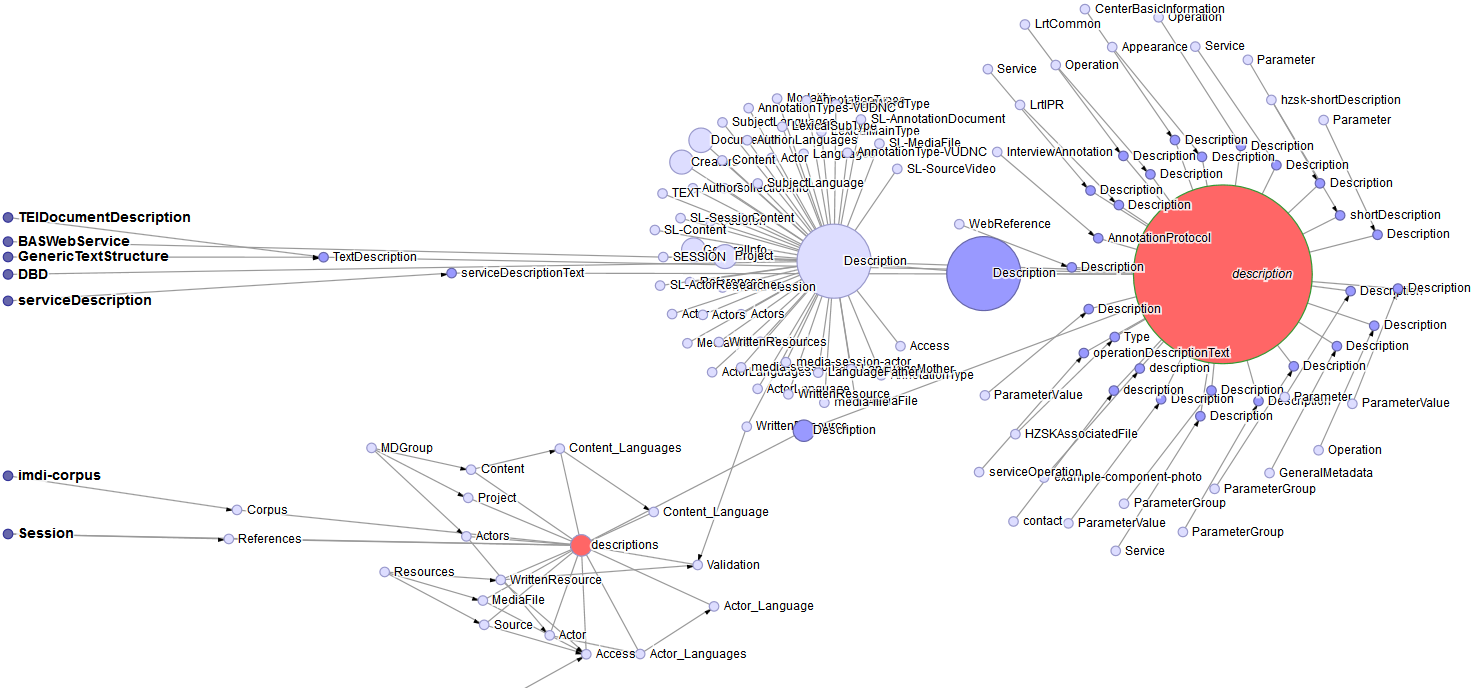
In this graph, the node size is set relative to the usage of given term within the whole CMD (option node-size=usage).
If we dig higher up the trees [SVG] (option depth-before=6) we get up to all the profiles using this data category (and all the paths), which becomes somewhat unreadable. Alternatively, we can inspect the related description component [DEF] in dot-layout [SMC] (dot-layout [SVG]) or as horizontal-tree [SMC].
Access
There are multiple components and elements describing access (access [SMC]) to a resource. Here are a few layout variants:


dublincore
There are multiple profiles modelling the dublincore terms [DEF]:
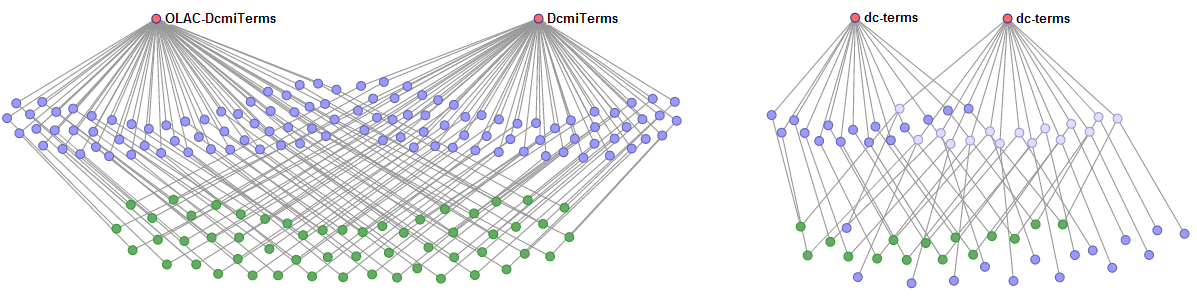
View dcterms and dcmiterms [SMC], dcterms and dcmiterms v-tree [SVG], dcterms and dcmiterms h-tree [SVG], dcterms and dcmiterms v-tree [PNG], dcterms and dcmiterms h-tree [PNG]
From the figure we can see the two distinct pairs of related profiles. The two with 'DcmiTerms' point to the dublincore terms the other two 'dc-terms' refer to dublincore elements. This is a good example for the role of Relation Registry. It allows to express relations beetween data categories, e.g. the equivalencies between dc-elements and dc-terms. (Displaying the relations from RR is soon to be added feature for SMC browser.)
The dublincore terms (or rather elements) are used as data categories in a few more profiles:
- teiHeader
- HZSKCorpus
- EastRepublican

Web Services
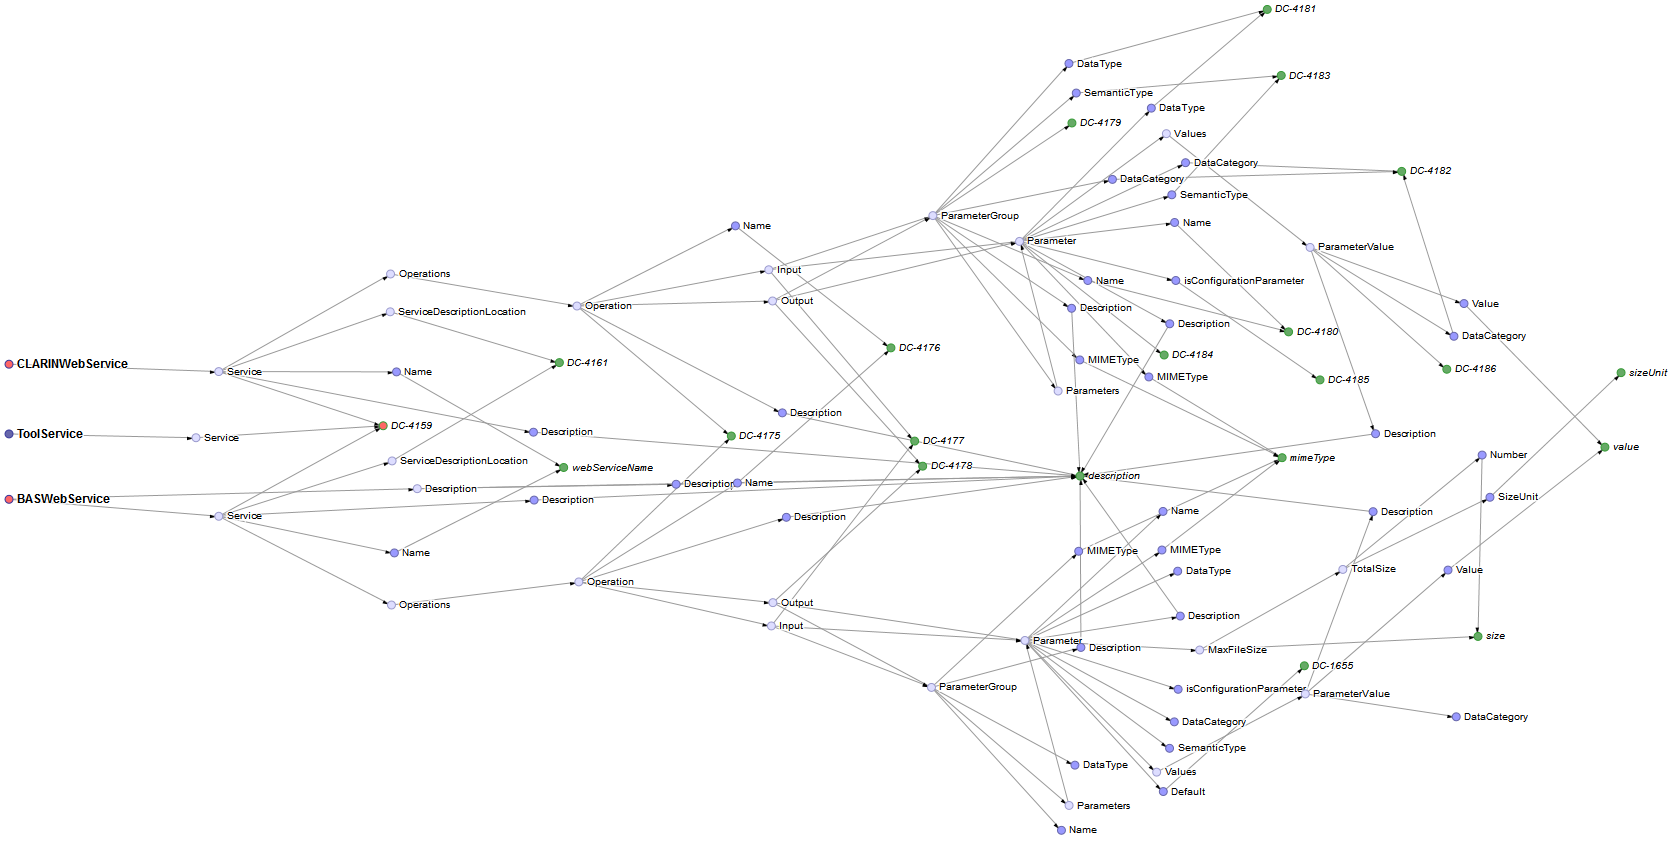
The below figure displays two profiles modelling WebServices: BASWebService [DEF] and CLARINWebService [DEF]. It nicely exposes the similarity and parallel structure of the two profiles as well as both of them binding to the same data categories. Although the graph shows completely only the two profiles, there are more related profiles: the ToolService [DEF] and the WeblichtWebService [DEF] The ToolService is also visible in the graph (related via the component data category DC-4159 [DEF]), but it is deliberately not selected, because it is too big and makes the graph unreadable. You can still view it separately: ToolService [SMC].
![description-datcat [SVG]](examples/description-datcat-smaller.svg)
![higher up the trees [SVG]](examples/description-datcat.svg)
![dot-layout [SVG]](examples/description-component-dot.svg)
![access-htree [PNG]](examples/access.png)
![access-htree [SVG]](examples/access.svg)
![access-dot [PNG]](examples/access-dot.png)
![access-dot [SVG]](examples/access-dot.svg)
![access-force [PNG]](examples/access-force.png)
![access-force [SVG]](examples/access-force.svg)
![dcterms and dcmiterms v-tree [SVG]](examples/dcterms-dcmiterms-vtree.svg)
![dcterms and dcmiterms h-tree [SVG]](examples/dcterms-dcmiterms.svg)
![dcterms and dcmiterms h-tree [PNG]](examples/dcterms-dcmiterms.png)
![dcmi-terms [SVG]](examples/dcmiterms.svg)
![dcmi-terms [PNG]](examples/dcmiterms.png)
![dc-terms horizontal-tree [SVG]](examples/dc-terms-htree.svg)
![webservices [SVG]](examples/webservices.svg)